Our Products
Welding Management
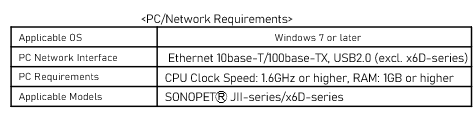
J-Tool Welding Management Software for PC
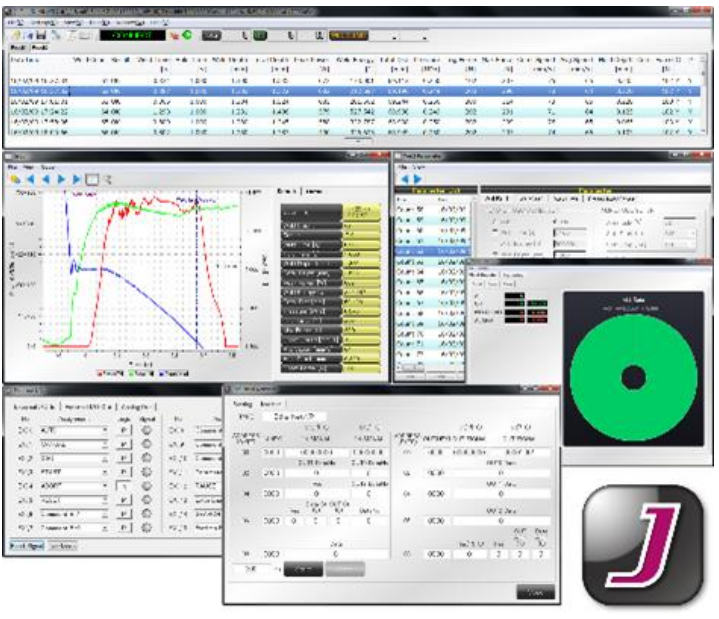
• Weld Result Data Management
With J-Tool, the welding result data can be displayed, saved and retrieved on a PC. The necessary data points can be selectively printed or exported as a CSV file.
• Weld Process Visualization
Time-elapsed graph shows the progression of power output, pressure, and/or weld depth values through the entire weld cycle.
• Weld Parameter Setting Management
J-Tool allows the user to retrieve and edit the saved weld parameter setting of the J/JII-series welder. The retrieved data can be edited on the PC and then can be uploaded to the welder via a USB/Ethernet connection.
• Generator Status Monitoring
When an alarm on the welder goes off, an alert message will be displayed
• Easy-to-Use, Customizable External Command Input/Output Settings
J-Tool can be used to set up the external input/output command values to be built into the automated system.
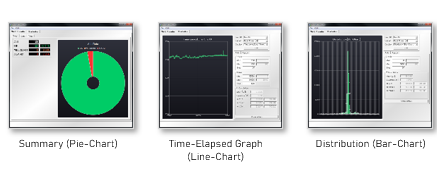
• Useful Weld Result Graph
The graph function makes each weld cycle clear and helps optimize welding parameter setting.
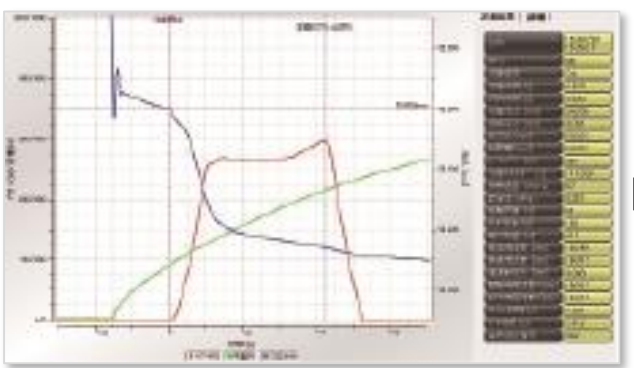
As time progresses, the weld depth (blue line) increases as power consumption (red line) drops off. This indicates that the welded rib is completely melted. Further welding progress may cause a negative effect on the workpiece.
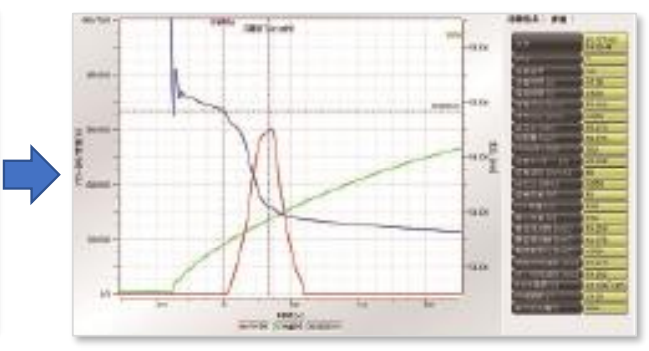
Optimized parameter settings minimize wasted power consumption, reduce risk of failure, and increase productivity. Being able to visualize the weld data helps to improve the weld process.
• Statics Chart Applications Examples A wide range of success/failure factors can be statistically analyzed for prompt responses to weld issues and preventive countermeasures.
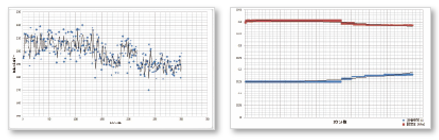
Success/failure log and welding result statistic data can be shown in various format of charts.
Ready to Step Into the Cutting Edge?

Contact Us
Headquarters
6236B Centre Park Drive
West Chester Twp
OH 45069